Budget reductions mean starker choices ahead for councils which will not be met simply by continuing to cut staff and services, says a new report.
 We compiled data from the Comprehensive Income and Expenditure Statement showing how councils spend across individual services. This is illustrated in an interactive graphic which compares individual councils with others in the rest of Scotland.
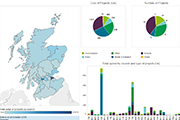 As part of the field work for our report Major capital investment in councils: a follow-up, we gathered data showing how councils procured major capital projects, and what type of projects were built. We have compiled this data into an interactive graphic.